Inside the Mind of a Top Trader: A Case Study by Copin
If you copy the trading strategy of this guy, you can achieve over 20% ROI right now!
Overview
In this post, I'll be analysing the profile of a trader who specializes in trading the altcoin LINK. This trader has a small capital but has a good track record of profitability.
This is the wallet address: [Link]
Before analysing deeper into his profile, let's get some basic information about him.
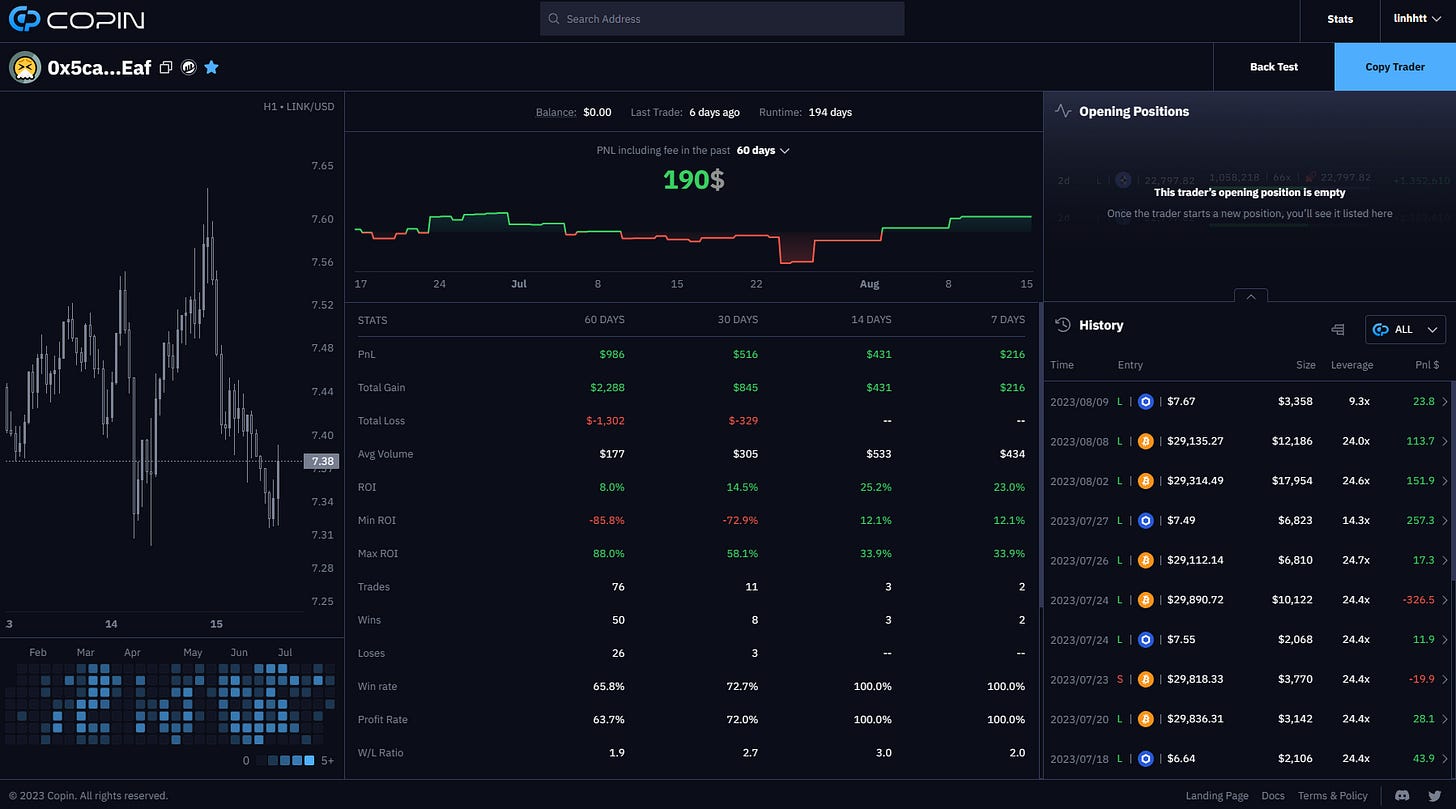
The wallet in this case study has been trading for 190 days. It mostly trades BTC, ETH, and LINK, but it has a particularly good track record with the altcoin LINK.
The trader's strengths are their trading frequency and their ability to come back from losses.
The trader's weaknesses are their tendency to open/close their positions too quickly and their lack of risk management skills.
Copin is a platform that allows you to deep-dive into the profiles of other traders, to see if their trading style is a match for your own. This can be a great way to learn from more experienced traders, or to find someone to copy-trade.
There are the 3 main parts of a Trader profile on Copin:
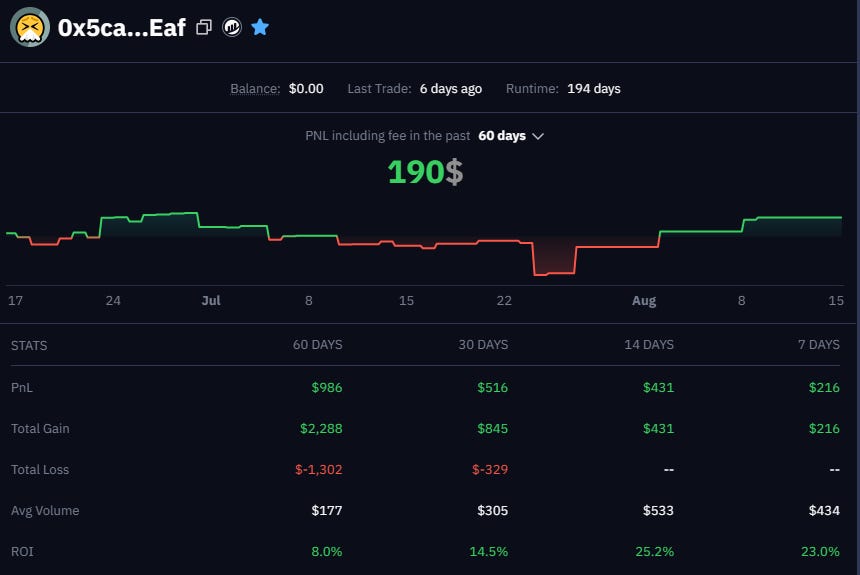
Stats: This section provides you with a general overview of the trader's performance, including their profit/loss, win rate, etc. Copin has over 22 powerful and diverse filtering criteria to analyse.
Position: This section shows you the trader's current open positions, as well as their recent trade history. It includes the Opening Position and the Transaction History
Charts: This section allows you to view the trader's trades on a chart, so you can see how they've been trading over time. The Eye version has 3 charts: The PnL profit fluctuation chart, Candlestick chart and the Trading frequency chart.
Statistical parameters
In this case, I have some interesting insights from this wallet:
The trader has been able to maintain their PnL and ROI over time, which is a good sign. Their average volume and balance are also relatively low, which suggests that they are trading with a small capital. This could be a green flag, as it means that they are not taking on too much risk.
The trader also has a small Order/Pos Ratio, which is another green flag. This means that they are not placing a lot of orders, which could indicate that they are a disciplined trader.
The trader's Avg Duration and trading frequency chart also show that they are making trades frequently, which could be a green flag. This suggests that they are active traders who are able to take advantage of market opportunities.
However, the trader does have a high Max DrawDown (larger then 80%), which is a red flag. This means that they have experienced a large loss in a single trade or over a period of time. This could be a sign that they are taking on too much risk.
As I mentioned above, Copin has over 22 statistical criteria to analyse trader performance, they can be divided into two groups: fixed parameters and percentage parameters.
Fixed parameters are recorded directly from the blockchain network of the DEXs as GMX
Percentage parameters are calculated based on the fixed parameters.
All of Copin's parameters are available for four timeframes: 60 days, 30 days, 14 days, and 7 days.
Do you need more information about Copin stats parameters? Here.
If you only want to do a quick scan of a trader's profile, I recommend focusing on the following criteria:
In the first version of Copin, users can view all of the stats tables with all criteria. However, they cannot customize the table to their own strategy. In future versions, users will be able to do this, which will save them time when finding a suitable trader to follow.
Specific positions
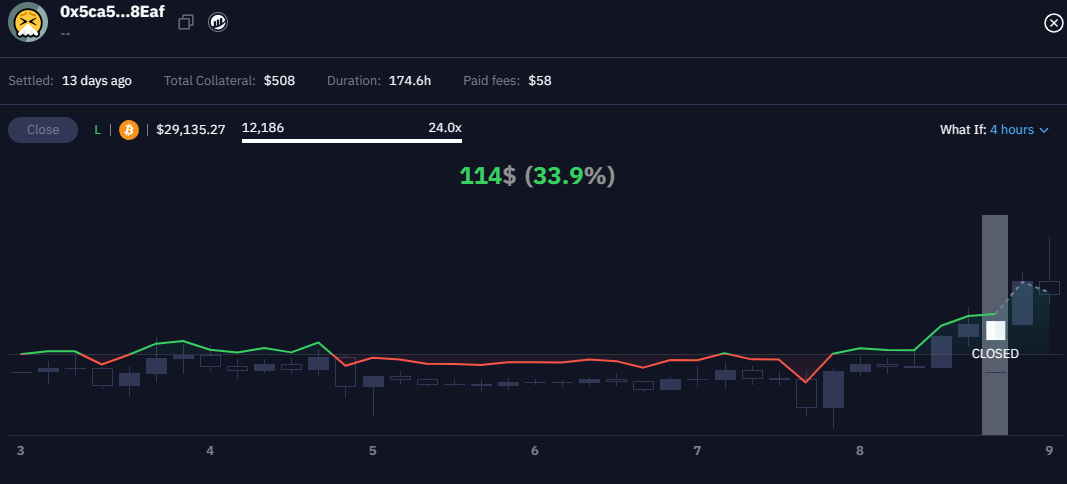
To understand the trader's strategy and performance, we can look at the candlestick chart. The candlestick chart shows the history of price movement and position history (open, close, increase, decrease) on the body of the candlestick. This gives us an overview of the trader's trading strategy.
To view the detailed history of each position, simply click on the respective position. The position's history includes relevant information such as entry points, exit points, profit/loss, duration, and any associated transactions.
The trader trades 3 chains: BTC, ETH, and LINK, with their best performance on the altcoin LINK. They have not traded ETH in the past month.
Their habits and trading style are as follows:
They rarely add orders to a position, and if they do, it is rarely more than 2 volumes.
From the charts, we can see that the trader has a weakness in their entry selection.
Their market judgment is not sharp enough, and they often hold positions for too short a time.
They also do not correctly choose between long and short positions.
When using the Copin "What if" feature, we can see that most of their positions are closed too early.
They often have positions that are liquidated, especially in BTC and ETH. Although their positions on ETH and BTC lose a lot, winning positions generate enough profits to offset their losses.
The trader took a break from trading altcoin LINK after two consecutive losing trades on July 5th and 6th. After that, they traded less frequently.
The position with the highest PnL suggests that the trader is changing their strategy. They are holding their positions for longer periods of time, and they are making more informed decisions about when to enter and exit trades. This is a positive sign, as it shows that the trader is learning and improving.
In addition, their most recent losing trade was almost liquidated by the exchange. This indicates that they are over-leveraging and may be taking too much risk. They need to be more careful with their trades in the future.
Backtesting
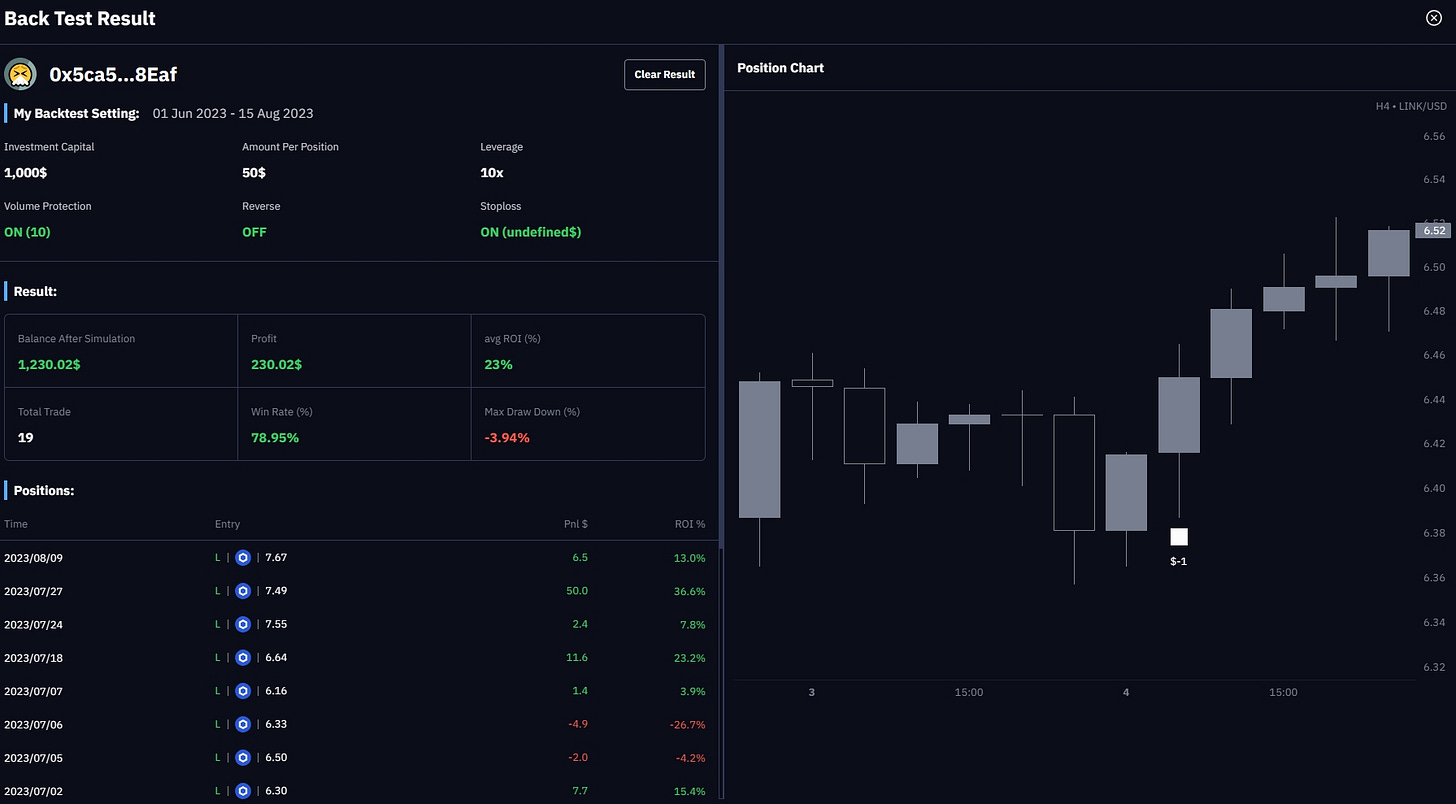
Backtesting is a simulation of a trader's trades based on the system's capital allocation strategy. Backtesting is run with real-time price data, so it can evaluate potential risks (maximum account drop rate, stop loss modelling) with high accuracy and real-time. After the backtesting is finished, you will have a more detailed look at the trader to help you make more accurate copy decisions.
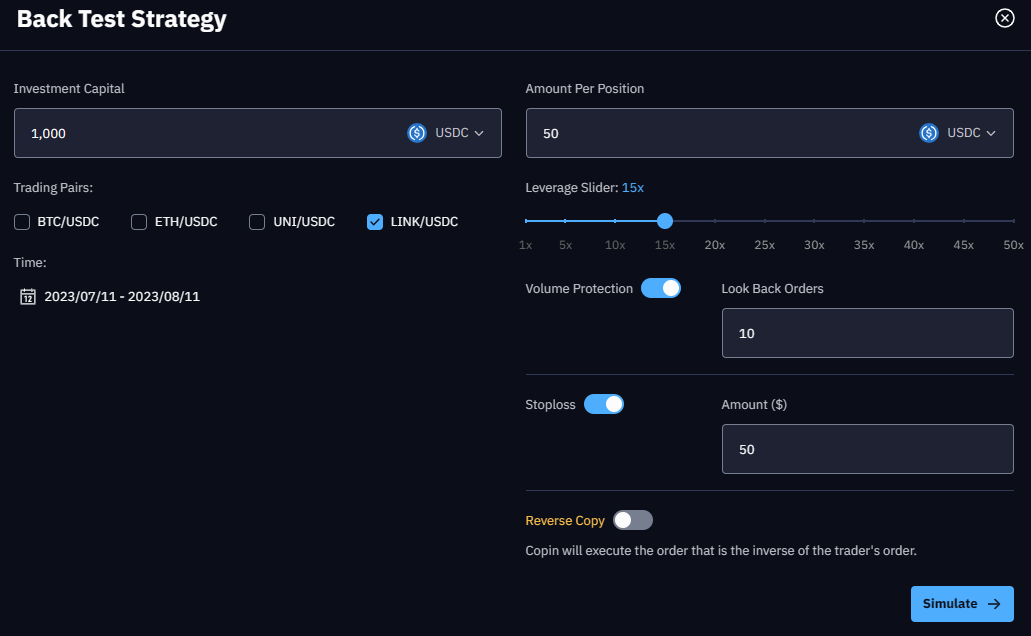
I used backtesting feature to simulate 3 scenarios.
Scenarios 1: Because the trader is strong in altcoins, specifically LINK, I only selected 1 chain in this backtesting. The volume was only 50, accounting for 1/20 of the account. I chose the time in the range of the most recent 1 month. I am still wondering about leverage and stoploss.
Scenarios 2: I turned off stoploss because this trader rarely fills orders (rarely more than 2 volumes), and the historical position shows that he/she is also always proactive in stoploss 1 volume.
Scenarios 3: I still haven't optimized the profit with this trader's strategy. Additional insights are that the leverage is relatively low, the volume after leverage is in the range of $1000 to $5000, try the leverage x10.
Past performance is not a guarantee of future results. It is important to do your own research (DYOR) and manage your own risk before copying any trader.
Overall, this trader has the potential to be very profitable. However, they need to work on their risk management skills and learn to hold their positions for longer. If you are a small-capital trader who is looking to learn from more experienced traders, then this is a profile worth checking out.
I encourage you to try Copin at https://app.copin.io and join our Discord to give us feedback. Your feedback will help us improve your experience with Copin and take your trading to the next level.








Identifying a trader and analyzing their trading history is really valuable. If we can use of that data and find effective ways to copy that trader, there's nothing better